The ROSMETER output
After processing, the user receives by email a compressed folder containing
the “analysis_results”.csv” file. This lists the correlation ranks of the submitted
transcriptome to each of the ROS indices. If several experiments are submitted simultaneously
the output includes another file “analysis_results.jpg” showing a clustogram which arranges
the transcriptomes according to their similarity to each other based on the ROSMETER results.
The folder "logs" contains a number of files each listing all the transcripts that were matched and
used in each particular query.
How to interpret ROSMETER correlations
Correlations values above 0.12 are the results of non-random correlations and correlations values above 0.45 are the results of strong correlations. To avoid misinterpretation of high correlation values resulting from the matching of only a small number of genes, only correlation values generated from the comparison of at least 45 genes are presented in the heatmap image. An example of the output file using abiotic stresses transcriptome data can be seen below in Figure 2. The results show high correlations to few of the indices and negative correlations to others. The results are clustered according to their similarities. Further explanations and examples are presented in Rosenwasser et al. 2013.
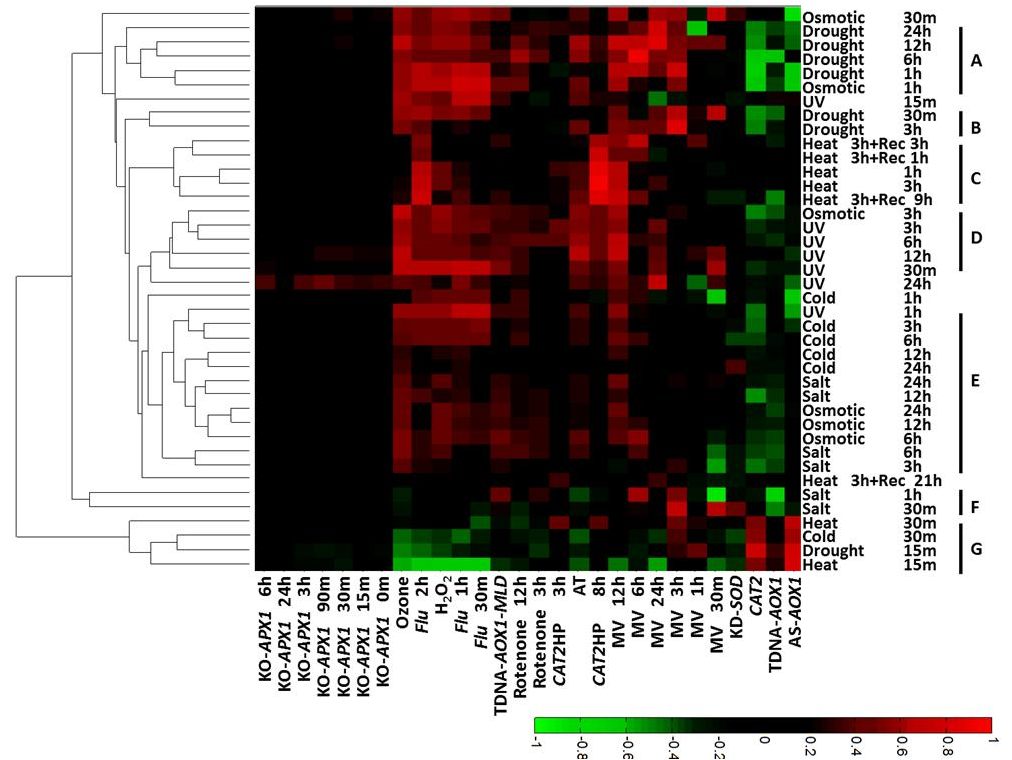
Figure 2: Output file showing the correlations between the indices and various abiotic stresses
as a clustogram.
The indices are listed on the abscissa (X) and the transcriptome
origin is listed on the ordinate (Y). The results are clustered according to the similarity of their profile.