How to submit to the ROSMETER website
How to prepare files for ROSMETER analysis
1. Two files should be prepared for analysis of gene expression data by the ROSMETER platform. The data file includes gene expression data and the instruction file includes the names of the experiment (see below). The input files can be prepared in Excel and should be saved as a csv files.
2. The data file includes fold change and p-value data for each comparison (e.g. treatment/control or mutant /control). These values should be pre calculated the user.
3. Fold change can be obtained by directly dividing the normalized results, i.e., treated sample compared to a control. For example it is possible to calculate the fold changes and the p values utilizing the "PARTEK Genomics solution" (Downey 2006) or using the ROBIN software (Lohse et al. 2010). Since the ROSMETER is based on Affymetrix platform, when using gene expression data retrieved from other platform such as, Agilent or RNAseq, the identifiers should be matched to the corresponds gene locus and Affymetrix Probeset ID. Note, matching between gene locus number and Affymetrix Probeset ID can be facilitated through the Excel 'VLOOKUP' function. The ‘example CSV input File’ can be used as a template to match gene locus (AGI) and Probeset ID.
4. The data file should include the Affymetrix Probeset ID (e.g., 245054_at) in column A and the gene locus (AGI, e.g., AT2G26460) in column B. Row 1 in column A should include the word “Probeset ID”, and in column B should include the word “locus” (as seen in Figure 1A).
5. The following columns C and D should include the p- value and fold change, respectively. Row 1 in column C should include the sign “P_” followed by the name of the experiment (e.g., P_MV_12h), and row D should include the sign “F_” followed by the same name of the experiment (e.g., F_MV_12h). If several experiments are to be scanned, the table should include a column of fold change and a column of p values for each experiment (E and F for experiment 2 and G and H for experiment 3, etc.) and row 1 should include the experiments’ names as described for column C and D. An example file for 2 experiments is shown in Figure 1A. The p-value for first experiment is in row C and its fold change is in row D. The second experiment is in rows E and F, respectively.
6. The instructions file (Figure 1B) should have captions F, P and E in row 1 of columns A, B and C, respectively. In row 2 columns A and B, should include the title of column D and title of column C from data files (Figure 1A). Row 2 in column C (under the letter E) should include the experiment titles, as it will appear in the output files. If several experiments are included, they should appear in consecutive rows. An example file for 2 experiments is shown in Figure 1B.
7. Following file preparation the files can be submitted to the ROSMETER analysis in the submitted data section.
Tip: For successful preparation of the ROSMETER files it is recommended to download the example files and paste your data into these file. In addition it is recommend to avoid using “/” or “*” symbols in the experiment names. Submitted files are limited a maximum file size of 10Mb. For analysis of large data sets, please contact us to:
Shilo Rosenwasser or Noa Sela
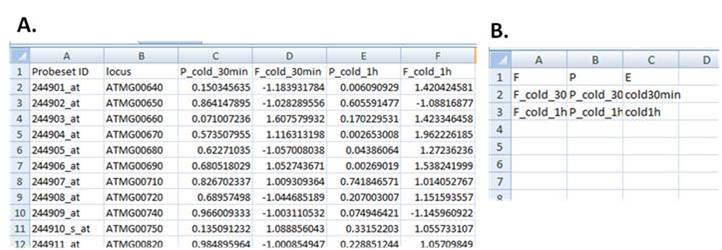
Figure 1: Example of data input files to ROSMETER.
Panel A, data input file. Panel B, Instruction file.